Climate and Seasons
Subscribe
https://meridian-archive.com/feed.xmlOpen in your app, or paste the link above into any other:
What the City Owed a Body
In the prewar apartments that housed most of the city’s renters through the 1990s, the law guaranteed a floor under the winter temperature and left the ceiling to one person. A landlord was required to hold an apartment at the city’s housing-code minimum temperature on winter mornings; the mechanism for meeting that requirement, in a five-story walkup or six-story elevator building with no individual thermostats, was the superintendent alone, reading the boiler’s steam pressure in the basement and the weather outside it. No tenant held a valve. No apartment metered its own draw. The result was ordinary and fully legal: apartments in the same building, on the same pipe, alternating between barely adequate and aggressively hot depending on the boiler’s mood, windows cracked in January to bleed off a surplus the code never addressed.
Manhattan’s street grid runs not east-west and north-south but rotated about thirty degrees clockwise from true compass orientation — a rotation that dates to the 1811 Commissioners’ Plan. The practical consequence, for anyone working in a Midtown office through the 1990s, was that direct sunlight arrived at a given facade some minutes earlier or later than a true compass reading would suggest, shifting the angle of morning light on the east-facing windows and compressing the afternoon shadow on Sixth Avenue into a narrower corridor than the buildings’ height alone would predict.
In November, at the latitude of Manhattan — forty and seven-tenths degrees north — the sun reached its maximum altitude at solar noon of roughly twenty-eight degrees. Sunrise came just before seven in the early part of the month; by the last week, sunset arrived at four thirty-two in the afternoon and the day ran to about nine and a half hours. By June, the geometry inverted: solar noon altitude near seventy-three degrees, sunset past eight-thirty, the sun standing high enough that the avenue canyons caught its light for most of the working day. Between those poles the city ran its annual cycle of lengthening and shortening, the angle of light at a given window shifting by several degrees each week.
At the editorial floors of the Midtown towers, the quality of daylight divided along a gradient that defined the interior visual world of the period. Near the bronze-tinted glass — a mid-century building material, common in the office towers of the 1950s and 1960s, installed for solar control — the light was warm and directional, raking across desks at a low angle through the autumn and winter mornings, bleaching flat through summer afternoons. Deeper into the floor, away from the perimeter, cool-greenish fluorescent overheads filled in what the windows could not reach. The two zones coexisted without transition: a person standing between them occupied both at once. Photographs taken on editorial floors of the period carry this gradient visibly — a warm edge, a cool center, the meeting line somewhere around the third or fourth desk row.
After dark, the city’s light came from the streetlights, and in New York from the mid-1970s through the end of the period, the streetlights were high-pressure sodium: cobra-head fixtures on davit-arm steel poles, spaced at intervals down the avenues and cross streets, emitting an amber light that suppressed blues and greens nearly to invisibility. Cars, skin, clothing — all of it read in shades of warm orange and brown under the sodium vapor. The city at night was monochromatic, and had been for long enough that no one who worked in it thought of it as monochromatic. It was simply what the night looked like.
The Wall of Heat
The working experience of a New York summer in the 1990s was not the summer itself — the parks, the fire hydrants opened illegally on side streets, the outdoor tables in front of the restaurants — but the transit between two cooled rooms: the office and the apartment, connected by a wet corridor of open city. The office was air-conditioned as a matter of commercial necessity; the apartment was another question.
The city’s prewar housing stock — the five-story walkups and six-story elevator buildings constructed before 1940, when window air-conditioning units did not exist and cross-ventilation was the design assumption — had not been built for mechanical cooling and was not efficiently retrofitted for it. Window units cost money to buy, money to run, and money to cool spaces that had high ceilings, single-pane windows, and brick facades that absorbed and released heat across a lag of several hours. In the lower-income neighborhoods, where the prewar stock was densest and the margins thinnest, cooling penetration through the 1990s was uneven: some apartments had a unit in one room; others had none. The buildings themselves ran hotter than towers with central systems, because the brick exterior stored the day’s heat and radiated it back after sunset, long after the official temperature had dropped.
What the inside of one of those apartments felt like on a late-July afternoon — a fourth-floor walkup in the East Village, fire-escape windows open, two box fans failing to circulate rather than cool the air — was its own distinct climate. By mid-morning the interior had reached the body’s own heat zone; by mid-afternoon it had exceeded it. The pillowcase was damp. The skin tasted of salt. The cigarette smoke from the apartment below came up through the radiator pipe. What counted as relief was leaving.
The city had a loose informal geography of relief. The Carnegie public libraries offered air conditioning and a reading table. The senior centers and church basements offered air conditioning and folding chairs. The large air-conditioned movie theaters — the ones in the Eighties on the Upper East Side, the ones on Forty-Second Street — offered three hours of refrigerated dark for the price of a ticket. The municipal cooling-center network was nascent through most of the period; what existed was improvised and community-specific, and in the neighborhoods that needed it most, it was patchwork.
The body-scale experience of summer was, in this way, a function of what neighborhood a person lived in and what floor. A sixty-four-year-old nurse leaving a fourth-floor walkup near University Avenue at a quarter past six in the morning for the tail of an overnight shift encountered a stairwell hotter than the apartment because the stairwell had no windows. The street at that hour was already in the upper seventies, with the day’s heat staged and climbing. The six blocks downhill to the Burnside Avenue station of the 4 train offered little: open air, but hot open air. The train platform was open to the sky and baking by nine; the train car was fiercely cold inside, a thirty-degree drop within a step, and by the time she changed at 149th Street Grand Concourse for the downtown 2 train and crossed the river toward the hospital, her uniform was dry again. The body, across a single commute, had moved through three climates. This was ordinary. It was done five days a week. Nobody wrote about it.
The heat wave of July 1999 was the decade’s defining summer event. Temperatures ran between ninety-five and a hundred degrees for weeks through the start of the month, and the city’s electrical system — designed for ordinary summer load with seasonal margin — ran under stress citywide from the first week. Con Edison’s network serving Washington Heights and Inwood, the neighborhoods of upper Manhattan north of 155th Street, had been running close to capacity through the sustained heat.
The Blackout
Just after ten in the evening on Tuesday, July 6, 1999, power cut out across the Con Edison Washington Heights and Inwood network in a single beat. Streetlights stopped. Bodega refrigerators went quiet. Building hallway lights went dark. The hum that apartments generate at night — from refrigerators, from exhaust fans, from window units that had been running since late June — stopped.
Within thirty seconds people leaned out of windows in T-shirts. The apartments, already near ninety-five degrees at the end of the day, had lost their only mechanical relief, and the bodies in them knew it immediately. Within five minutes the avenues filled — Broadway and St. Nicholas and the side streets between them — because the streets, at least, had moving air. Candles appeared in windows by eleven. Battery radios came out on stoops and were tuned to 1010 WINS. A man sold flashlights from a cooler at five dollars each on a corner near 168th Street. By one in the morning some of the cross streets in the upper West 160s were dark enough — the amber sodium-vapor streetlights extinguished, the lit windows of the high-rises above supplanted by candle points — that stars were visible over upper Manhattan, a fact so unfamiliar that people mentioned it to strangers.
An NYPD light tower arrived at 168th Street and Broadway. The hospitals operated on emergency power. Elevators in the high-rises were dead; the elderly in the upper floors stayed where they were.
From a south-facing office on a high floor above Fiftieth Street, the geography of the failure was precise and legible. The Empire State Building was lit, as was the Chrysler Building, as were the towers at the lower end of Manhattan. Everything north of approximately 155th Street was absent — a black absence in the skyline where a borough’s worth of windows and streetlights should have been. The city had been deleted by section, the deletion visible from miles away, the boundary drawn at a utility substation’s service territory.
Power was restored after more than eighteen hours. The Attorney General’s report published the following March found that the Washington Heights and Inwood feeder network had suffered multiple cable failures and that Con Edison’s maintenance practices on those cables had been deficient over an extended period.1 The cables had been aging. The heat had stressed them past a threshold. The neighborhoods they served happened to be the ones north of 155th Street — heavily Dominican, heavily immigrant, among the lower-income neighborhoods in Manhattan. Whether those facts were connected in the maintenance-scheduling decisions that preceded the failure, the Spitzer report was careful in what it asserted and careful in what it left for the reader to assemble.
The lights returned in the morning of July 8. The skyline was whole again. The asymmetry that had been visible — to anyone paying attention from a high floor in midtown — for eighteen hours went back to being invisible, the way it had been before and would be after.
The Cold and the Storm
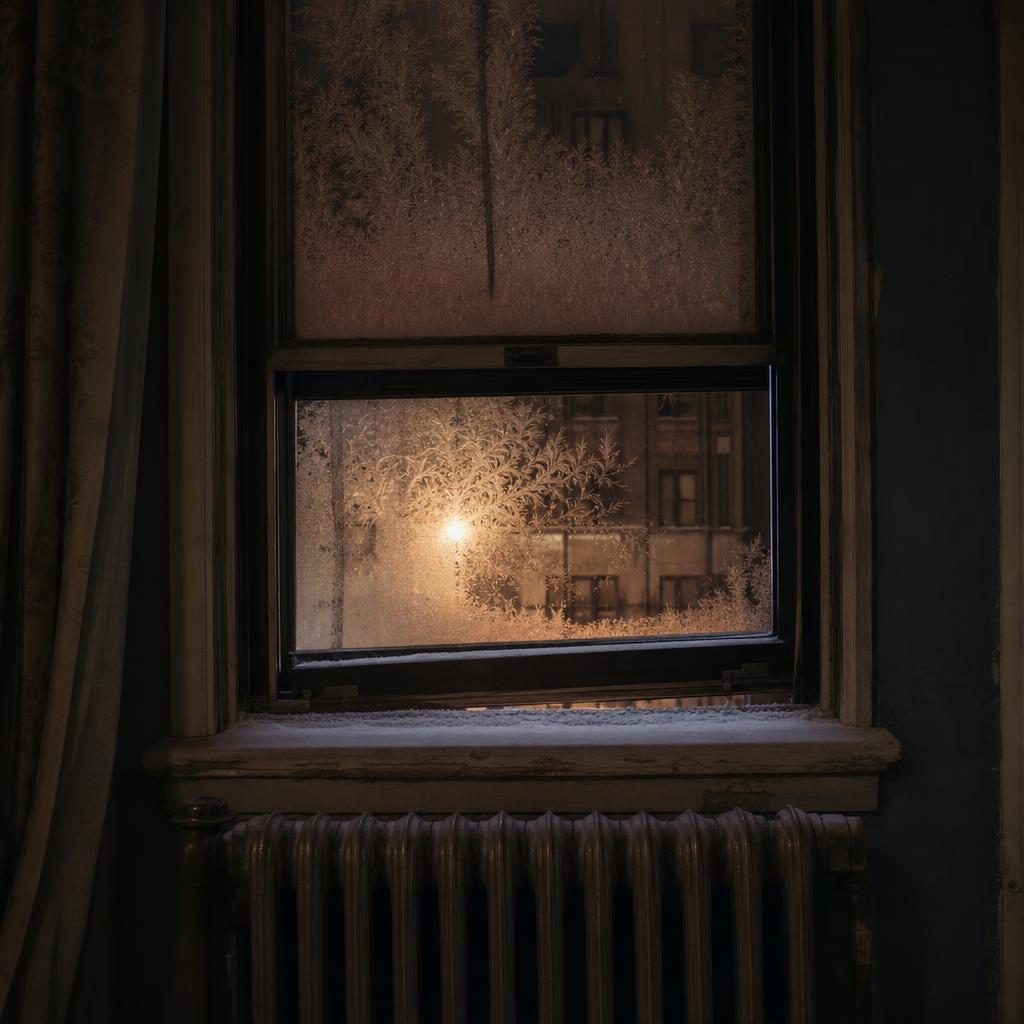
The winter register ran counterpoint to the summer’s. In the prewar apartments, the steam radiator was the instrument of the season — a cast-iron device connected to a central boiler in the building’s basement, banging and hissing as the steam pressure fluctuated. Central heating was not quiet. It announced itself. The regulation set a floor; the system’s imprecision set the ceiling wherever it chose.
In the Midtown office towers, the perimeter offices — the rooms with external windows — ran cold along the glass on winter days. The single-pane bronze windows that held back the summer light offered little insulation against the cold; on a January morning, the air near the glass was perceptibly cooler than the air six feet back, and an editor who sat near the window for the early draft session of a winter morning felt the cold radiating inward along the arm. The radiator on the sill threw heat upward; the glass gave it back in the other direction. The desk between them was the negotiated zone.
The Blizzard of 1996 arrived on the weekend of January 6. By Monday morning, January 8, Central Park had recorded 20.2 inches — the fourth-largest single-storm total in the city’s official records, which go back to 1869.2 The Northeast Snowfall Impact Scale, a retrospective classification system, rated the storm Category 5: Extreme.3 The New York City public schools closed on the morning of January 8 — the first citywide school closure since the storm of February 1978.4
The view from a fourteenth-floor Midtown office on the morning of the eighth was a revision of the city’s geometry. Bryant Park lay as a single white plane — the chairs stacked or buried, the paths erased, the hedgerows reduced to white shapes without edges. Sixth Avenue below was empty of taxis; a single set of bus tire tracks scored the unbroken white surface of the avenue from somewhere to the north and disappeared somewhere to the south, the only evidence that the city’s arterial grid was still, minimally, operating. Steam rose in vertical columns from the manhole covers along the avenue, undisturbed by traffic, moving straight up in the still cold air until it dispersed against the grey-white sky. The buildings across the park stood as flat silhouettes; snow had accumulated on every windowsill and softened every ledge and cornice, rounding the geometry of the midcentury towers into something almost domestic. The light was grey-white and shadowless. People who had come in on Sunday afternoon and slept on office couches were quieter than usual. The city outside was silent in the way cities are only when the automobile has been removed from them.
The thaw that followed brought flooding — storm drains overwhelmed, basements along the cross streets below street grade taking water, the surface water running in sheets down the avenues toward the river outflows. The city’s drainage system, designed for rain rather than rapid snowmelt, worked against the volumes for several days before the streets dried.
Hurricane Floyd, arriving on September 16, 1999 — three months after the blackout, in the same year — had been downgraded to tropical storm by the time it reached New York, but it dropped up to about thirteen inches of rain in some areas of the metropolitan region and sixty-mile-per-hour wind gusts across the city.5 The FDR Drive at 72nd Street flooded. The New York City public schools closed — only the second closure since the blizzard of January 1996. New Jersey sustained widespread flooding; the storm’s remnant tracked inland and remained coherent across the region for a day. Two named events in one year — July and September — placed 1999 in a category of its own within the period for atmospheric disruption.

The city had a climate long before it had a policy on the climate. Across 1989 to 2001, weather was the one force the municipal government did not pretend it could legislate — the snow could be cleared, the storm drains widened, cooling centers opened in church basements — but the air itself was unowned. What the climate revealed, in its annual cycle and in its occasional named events, was the unevenness with which the city’s bodies absorbed it. The summer was longer in a fourth-floor walkup than in a doormanned tower; the winter was colder at a single-pane window than beside the steam radiator two feet away; the blackout north of 155th Street did not interrupt the lit skyline to the south. None of this was secret and none of it was policy. It was simply the way the city’s air found the bodies under it. The temperature you carry in memory from a given year is the temperature your body was at; the temperature the city records is the temperature at the official instruments in Central Park. The gap between those two numbers is where most of the city actually lived.
The blizzard of January 1996 would have gone into The City as service journalism: the borough-by-borough logic of the Sanitation Department’s plow routes, set against a storm that had closed the public schools for the first time since 1978, the piece closing for the March issue while snow still stood on the avenues. Hurricane Floyd, three years on, would have earned the same section on the same terms — the flooded FDR Drive, a second school closure inside the decade, the storm’s path through the region rendered as infrastructure rather than weather, held for the November book. Both would have run clean, signed off without argument, the kind of piece the floor could turn around without a fight.
Left unassigned would have been the register no closure order or drainage report could carry: what the cold or the standing water had actually done to a body with nowhere adequately heated or drained to go. The City would have told a reader how Sanitation ranked its routes and how a storm’s rainfall total compared with the prior record. It would not have told her what a January stairwell felt like with the boiler two floors down losing pressure, or what a basement apartment on a flooded cross street looked like at four in the morning with the water still rising. Nobody would have pitched it, and so nothing would have been there to kill. A monthly’s beat would have run through agencies before it ever reached a building’s super, and the two pieces that would have run would have measured the storm the way the city measured itself, in feeder networks and cubic feet per second.
Footnotes
-
Eliot Spitzer, Attorney General of the State of New York, Equipment Flaws and Weaknesses Caused Blackout in Washington Heights/Inwood and Other Areas Last Summer (Office of the Attorney General, March 2000). ↩
-
National Weather Service, New York forecast office, storm summary for the January 6–8, 1996, blizzard (Central Park 20.2-inch total). ↩
-
Paul J. Kocin and Louis W. Uccellini, “A Snowfall Impact Scale Derived from Northeast Storm Snowfall Distributions,” Bulletin of the American Meteorological Society 85, no. 2 (February 2004): 177–194. ↩
-
Baruch College / CUNY, NYCdata project, “Blizzard of 1996” entry (Center for the Study of Business and Government). ↩
-
Stacy R. Stewart, Tropical Cyclone Report: Hurricane Floyd, 7–17 September 1999 (National Hurricane Center, NOAA, 2000). ↩